Fig. 2
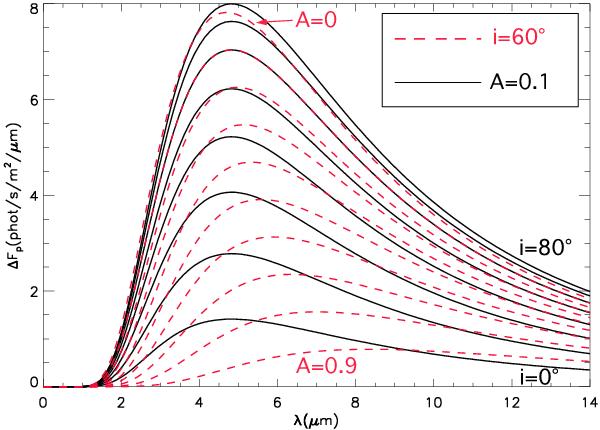
Effect of inclination and albedo on the variation spectrum. The peak amplitude of the phase curves is given as a function of wavelength for a planet at 0.04 AU from a 0.5 M⊙ star. Solid curves are obtained with an albedo of 0.1 and inclinations ranging from 0 to 80°. Dotted curves are calculated for an inclination of 60° and albedo ranging from 0.1 to 0.9.
Current usage metrics show cumulative count of Article Views (full-text article views including HTML views, PDF and ePub downloads, according to the available data) and Abstracts Views on Vision4Press platform.
Data correspond to usage on the plateform after 2015. The current usage metrics is available 48-96 hours after online publication and is updated daily on week days.
Initial download of the metrics may take a while.