Fig. 5
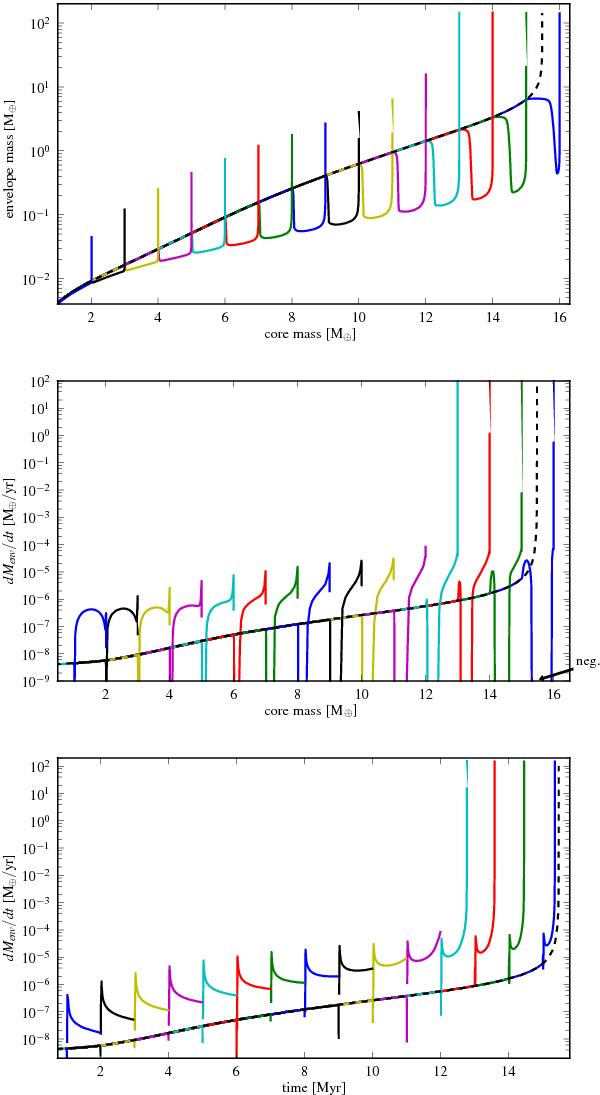
Envelope mass and gas accretion rate following impacts of 1 M⊕. The calculations with core masses 12–15 end prematurely because gas accretion becomes supersonic. The dashed line represents the NC in all panels. The lower panels show the gas accretion rate in log-scale. Note that all values below 10-9 actually become negative. The lowest panel shows the envelope accretion rate as a function of time – the constant core accretion rate was used to convert the core mass to a proxy time. Each color represents a different planet having an impact that has evolved to this point by constant core growth. The very high accretion rate directly after the impact is similar to the shut-off case. In case of shut-off the accretion rate rises immediately but in the impact case, the impact and ejection causes a delay (not visible on this scale). Afterwards the evolution is practically identical. For large impacts, the henceforth larger core mass leads to a significantly higher accretion rate when compared to the shut-off case.
Current usage metrics show cumulative count of Article Views (full-text article views including HTML views, PDF and ePub downloads, according to the available data) and Abstracts Views on Vision4Press platform.
Data correspond to usage on the plateform after 2015. The current usage metrics is available 48-96 hours after online publication and is updated daily on week days.
Initial download of the metrics may take a while.