Fig. 2
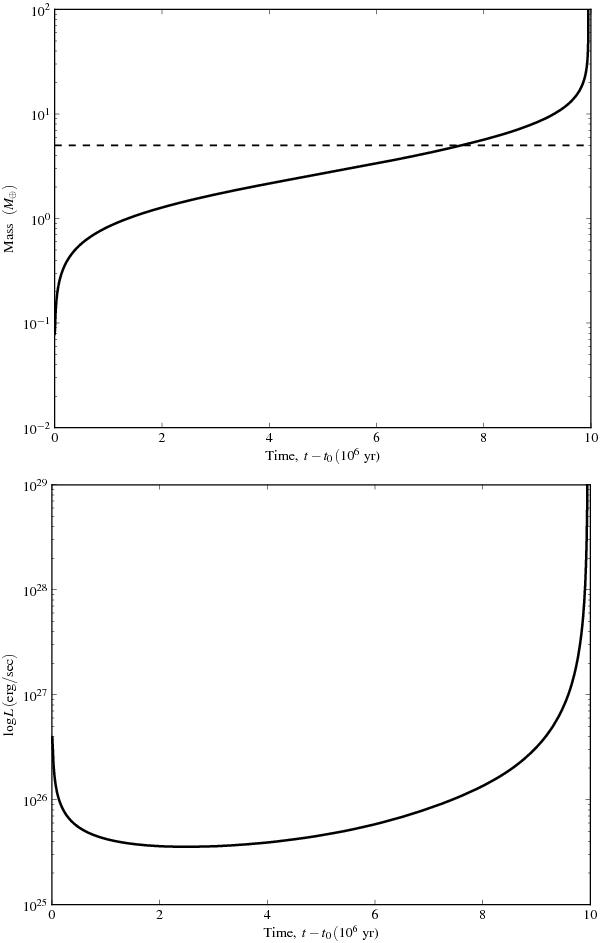
Time evolution of the envelope after core accretion is halted in the case of Mcore = 5 M⊕. The upper panel (a) shows the envelope mass Menv (solid line) and the core mass Mcore (dashed line) and the lower panel (b) presents the luminosity L. This is in good agreement with Ikoma et al. (2000), Fig. 2, even though the used opacities from Ferguson et al. (2005) (g98.7.02.tron) are not exactly equivalent.
Current usage metrics show cumulative count of Article Views (full-text article views including HTML views, PDF and ePub downloads, according to the available data) and Abstracts Views on Vision4Press platform.
Data correspond to usage on the plateform after 2015. The current usage metrics is available 48-96 hours after online publication and is updated daily on week days.
Initial download of the metrics may take a while.