Fig. 11
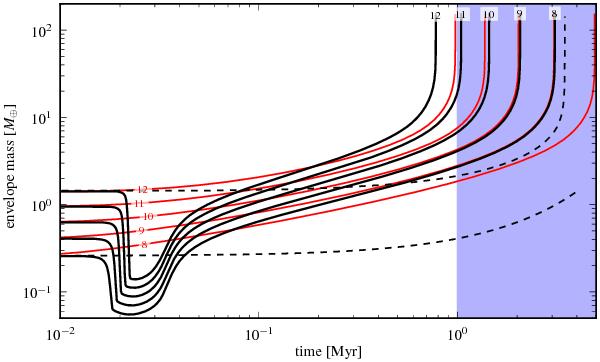
Gas accretion compared to shutdown scenario. Black lines show the envelope mass after 1 M⊕ impacts on cores of 8–12 M⊕. Red lines show the evolution when the core accretion rate is simply shut off with the same timescale and to the same background rate instead of impacting 1 M⊕. Dashed lines show the envelope mass of the NC for the largest and smallest target. At 1 Myr the NC and the impact case have the same core size. Cases 8–11 have been extended beyond the 1 Myr tcomp that was usually adopted to compare to the NC.
Current usage metrics show cumulative count of Article Views (full-text article views including HTML views, PDF and ePub downloads, according to the available data) and Abstracts Views on Vision4Press platform.
Data correspond to usage on the plateform after 2015. The current usage metrics is available 48-96 hours after online publication and is updated daily on week days.
Initial download of the metrics may take a while.