Fig. 10
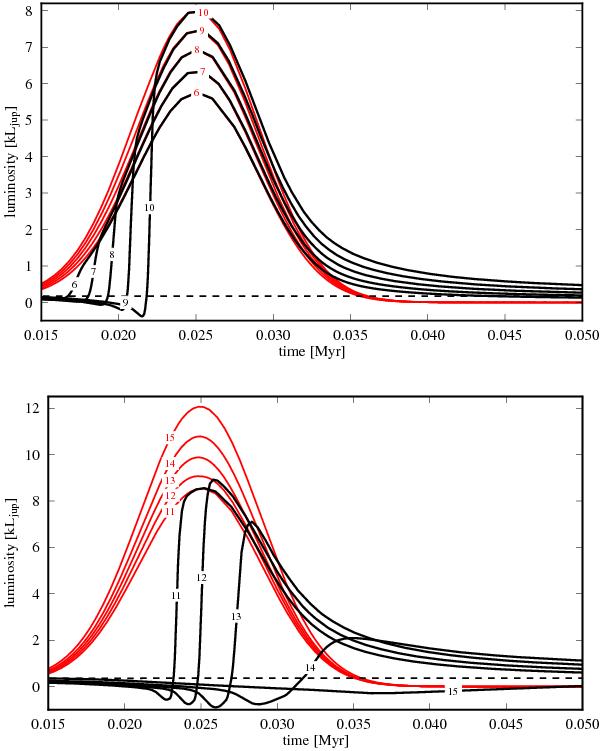
Luminosity during impacts of 1 M⊕ for target core sizes from 6–10 M⊕ (top) and 11–15 M⊕ (bottom). The thick black line shows the total luminosity and the thin red lines show the core luminosities. Small labels indicate the target core mass in M⊕. For reference, the dashed line shows the nominal case of gradual core growth for the most massive target.
Current usage metrics show cumulative count of Article Views (full-text article views including HTML views, PDF and ePub downloads, according to the available data) and Abstracts Views on Vision4Press platform.
Data correspond to usage on the plateform after 2015. The current usage metrics is available 48-96 hours after online publication and is updated daily on week days.
Initial download of the metrics may take a while.