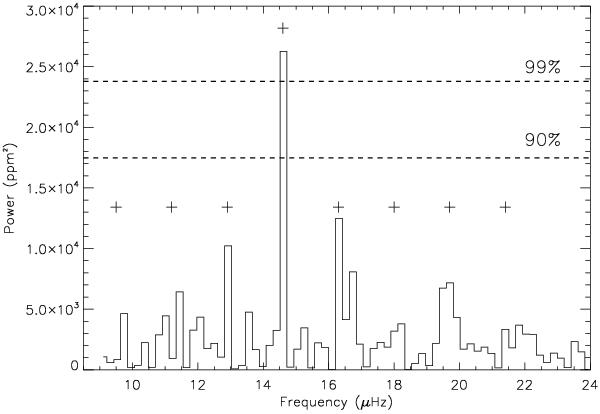
Fig. 4

Power spectrum of the light curve shown in Fig. 1, once the contribution of the background noise has been removed (see text). No oversampling is used in order to compute the statistical levels of confidence. The dashed lines indicate the 99% and 90% levels of confidence for detection (see text). The crosses indicate frequencies that are equally spaced by the value found from the power autocorrelation, 1.7 μHz.
Current usage metrics show cumulative count of Article Views (full-text article views including HTML views, PDF and ePub downloads, according to the available data) and Abstracts Views on Vision4Press platform.
Data correspond to usage on the plateform after 2015. The current usage metrics is available 48-96 hours after online publication and is updated daily on week days.
Initial download of the metrics may take a while.


