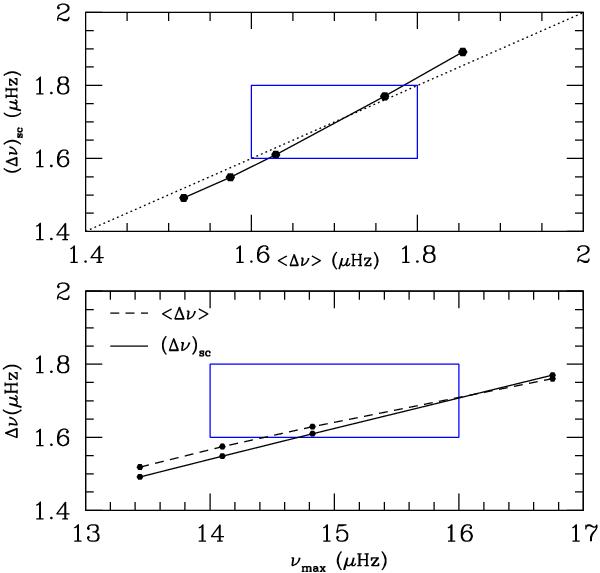
Fig. 12

Upper panel, solid line: Δνsc, computed from the scaling relation (Eq. (2)) and the modeled mass and Teff versus Δν computed from the actual frequencies given by the optimal model (the blue frame indicates the observations); lower panel: Δνsc and Δν versus the computed νmax from Eq. (1) for a series of models satisfying the observations represented as the blue frame. This validates the use of the scaling relations in the computations.
Current usage metrics show cumulative count of Article Views (full-text article views including HTML views, PDF and ePub downloads, according to the available data) and Abstracts Views on Vision4Press platform.
Data correspond to usage on the plateform after 2015. The current usage metrics is available 48-96 hours after online publication and is updated daily on week days.
Initial download of the metrics may take a while.


