Fig. 4
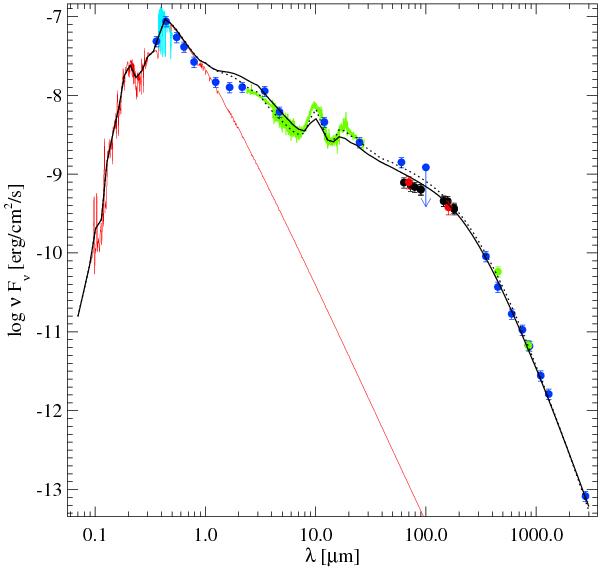
Spectral energy distribution for the best-fit fully mixed disc model (“preferred” model), obtained from a simultaneous fit to the observed SED, ISO-SWS spectrum and line emission from HD 163296 (solid black line). Black dotted line indicates the SED for the model with power-law density profile, which is unable to fit the mm continuum image for HD 163296. Blue circles indicate (with increasing wavelength) simultaneous UBVRIJHK photometry (Eiroa et al. 2001; Oudmaijer et al. 2001), LM photometry (de Winter et al. 2001), IRAS photometry (12–100 mic), sub-mm photometry (Mannings 1994), and millimetre photometry (Isella et al. 2007). Also marked are PACS photometric observations (red circles), PACS continua derived from the spectroscopic observations (black circles), SCUBA photometry (green circles) (Sandell et al. 2011), scaled VLT/UVES spectrum (blue line, Martin-Zaidi, in prep.) and the ISO-SWS spectrum (green line). The red line shows the stellar+UV input spectrum. Downwards arrow denotes upper limit. All fluxes were corrected for interstellar reddening using the Fitzpatrick parameterisation (Fitzpatrick 1999) with RV = 3.1 and E(B − V) = 0.15.
Current usage metrics show cumulative count of Article Views (full-text article views including HTML views, PDF and ePub downloads, according to the available data) and Abstracts Views on Vision4Press platform.
Data correspond to usage on the plateform after 2015. The current usage metrics is available 48-96 hours after online publication and is updated daily on week days.
Initial download of the metrics may take a while.