Fig. 15
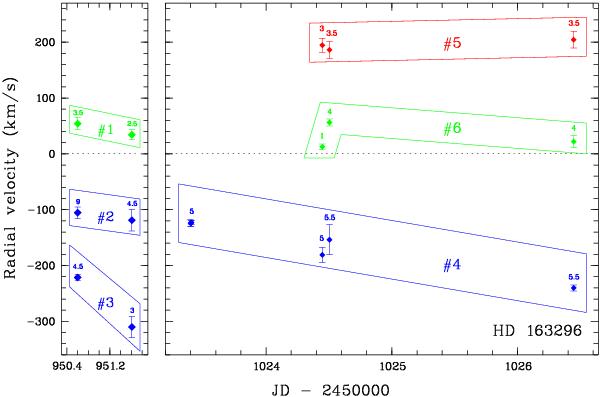
Kinematics of the circumstellar gas. Features with similar radial velocity observed in different lines and different dates are assumed to share a common origin and grouped into events. Each event is represented by a box enclosing a number of points. Each point represents the weighted average of the radial velocity simultaneously measured for several lines. The error bar is the standard deviation. The weighted number of lines is given next to each point. Red boxes represent in-falling material, blue boxes out-flowing material and green boxes in-falling material only detected in metallic lines.
Current usage metrics show cumulative count of Article Views (full-text article views including HTML views, PDF and ePub downloads, according to the available data) and Abstracts Views on Vision4Press platform.
Data correspond to usage on the plateform after 2015. The current usage metrics is available 48-96 hours after online publication and is updated daily on week days.
Initial download of the metrics may take a while.