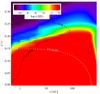
Fig. 11
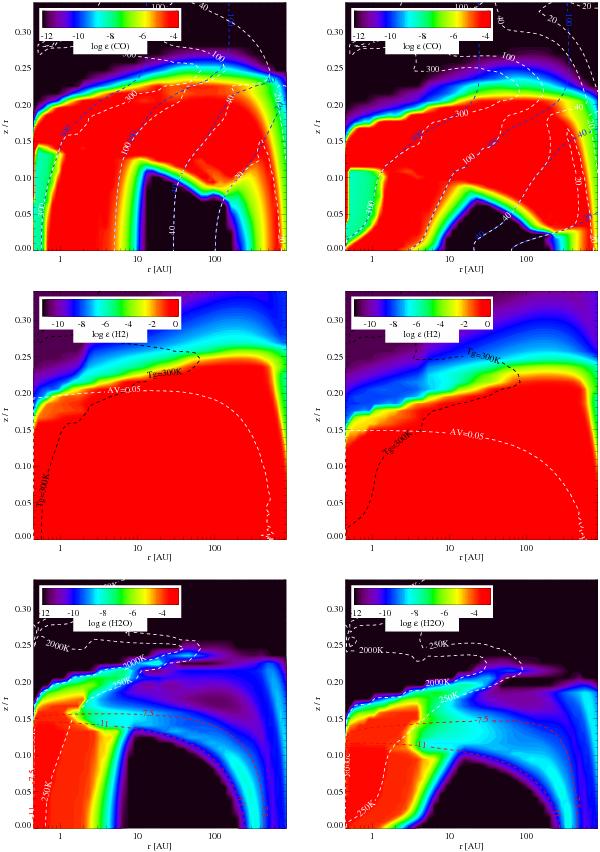
Effect of dust settling on the disc chemical abundances. Left column indicates abundances in a fully mixed model, and right column represents a strongly-settled model with otherwise identical parameters. Top row: CO abundance with dust (blue dashed lines) and gas (white dashed line) temperature contours. Middle row: H2 abundance with 300 K gas temperature contour (black dashed line) and visual extinction contour (white dashed line). Bottom row: H2O abundance. White dashed lines indicate Tgas contours enclosing “hot water” region, red dashed lines indicate contours of UV field strength per hydrogen nucleus, log (χ/nH) as defined in Draine & Bertoldi (1996), enclosing the cool water belt.
Current usage metrics show cumulative count of Article Views (full-text article views including HTML views, PDF and ePub downloads, according to the available data) and Abstracts Views on Vision4Press platform.
Data correspond to usage on the plateform after 2015. The current usage metrics is available 48-96 hours after online publication and is updated daily on week days.
Initial download of the metrics may take a while.