Free Access
Fig. 9
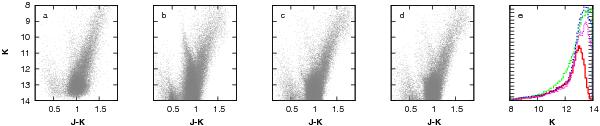
Colour–magnitude diagrams for the 2MASS field at l = 0, b = −4. a) data; b) best-fit model with 1 ellipsoid; c) best-fit models with 2 ellipsoids; d) modified model with flared bar; e) histograms of data (red solid) and models (1 ellipsoid: green long dashed; 2 ellipsoids: blue dotted, flared bar: magenta short dashed).
Current usage metrics show cumulative count of Article Views (full-text article views including HTML views, PDF and ePub downloads, according to the available data) and Abstracts Views on Vision4Press platform.
Data correspond to usage on the plateform after 2015. The current usage metrics is available 48-96 hours after online publication and is updated daily on week days.
Initial download of the metrics may take a while.