Fig. 4
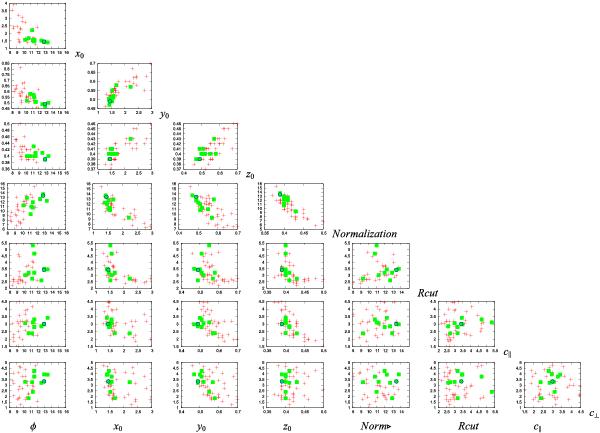
Distribution of solutions for the main bulge population (first ellipsoid) with regards to its parameters. Columns are, from the left to the right: angle in degrees, scale length x0, y0, z0 in kpc, central mass, c∥ and c⊥ . Rows are given in the same order from top to bottom. Red plus signs indicate all likelihood, squares hold for the 10 best likelihoods, the blue circle for the best solution.
Current usage metrics show cumulative count of Article Views (full-text article views including HTML views, PDF and ePub downloads, according to the available data) and Abstracts Views on Vision4Press platform.
Data correspond to usage on the plateform after 2015. The current usage metrics is available 48-96 hours after online publication and is updated daily on week days.
Initial download of the metrics may take a while.