Fig. 2
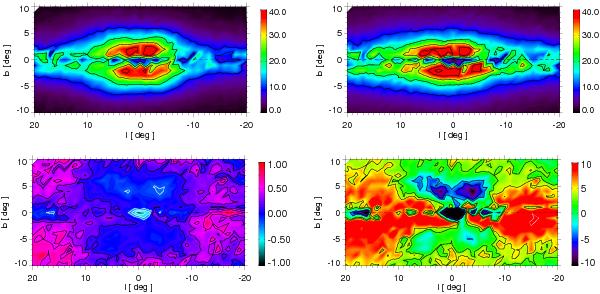
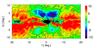
Star counts up to limiting magnitude Ks from 2MASS data (top left) compared with fitted 1 ellipsoid model B (top right), residuals (Nmod − Nobs)/Nobs (bottom left), and difference divided by the Poissonian counting error of the model (i.e. (Nobs − Nmod)/ (bottom right). In the residual map, contours are drawn at intervals of 20% model overestimate (black) and 20% model underestimate (white). The 1-ellipsoid model leaves significant X-shaped residuals. Near the Galactic centre the nuclear bar population is missing in the model. The residuals in the outer regions are not very significant due to the small number of stars in each bin (seen in the top left panel in dark violet and black).
Current usage metrics show cumulative count of Article Views (full-text article views including HTML views, PDF and ePub downloads, according to the available data) and Abstracts Views on Vision4Press platform.
Data correspond to usage on the plateform after 2015. The current usage metrics is available 48-96 hours after online publication and is updated daily on week days.
Initial download of the metrics may take a while.