Fig. 17
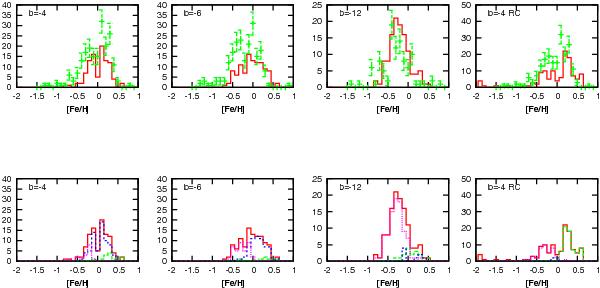
Metallicity distribution for RGB samples from Zoccali et al. (2008) in fields at l = 0° and b = −4°, –6°, and –12°, and for the red clump samples from Hill et al. (2011) in Baade’s window (columns from left to right). Top: the observed data (green dots with Poisson noise) are compared with model simulations, applying the same selection function as in the observations (red solid lines). Bottom: decomposition in populations of the model simulation. Red solid line: total; green long dash: disc, short dash blue: boxy bar; dotted magenta: thick bulge. The error bars take only the Poisson noise into account and not the observational errors or the metallicity or the error in the selection function estimation.
Current usage metrics show cumulative count of Article Views (full-text article views including HTML views, PDF and ePub downloads, according to the available data) and Abstracts Views on Vision4Press platform.
Data correspond to usage on the plateform after 2015. The current usage metrics is available 48-96 hours after online publication and is updated daily on week days.
Initial download of the metrics may take a while.