Free Access
Fig. 14
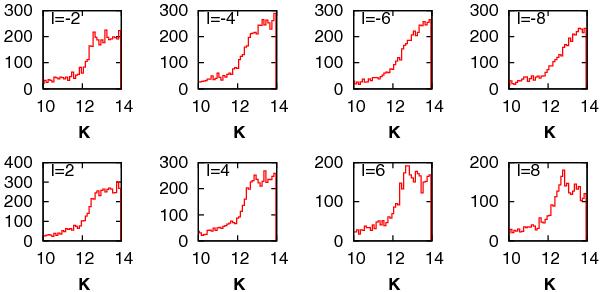
Luminosity functions for the red clump region in fields at latitude –8°. Coordinates in longitude and latitude are indicated in each panel. The double-clump feature is simulated by adding a slight flare to the original bar model (see text).
Current usage metrics show cumulative count of Article Views (full-text article views including HTML views, PDF and ePub downloads, according to the available data) and Abstracts Views on Vision4Press platform.
Data correspond to usage on the plateform after 2015. The current usage metrics is available 48-96 hours after online publication and is updated daily on week days.
Initial download of the metrics may take a while.