Free Access
Fig. 13
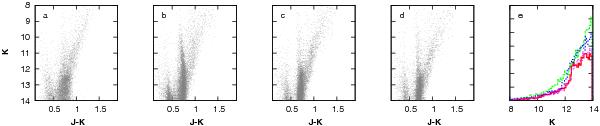
Colour–magnitude diagrams for the 2MASS field at l = 0, b = −8. Same coding as in Fig. 9. In this field we see clearly in the histogram the double clump feature reproduced by the modified model (panel d) and magenta line) and not by the originally fitted model (panel c) and blue line).
Current usage metrics show cumulative count of Article Views (full-text article views including HTML views, PDF and ePub downloads, according to the available data) and Abstracts Views on Vision4Press platform.
Data correspond to usage on the plateform after 2015. The current usage metrics is available 48-96 hours after online publication and is updated daily on week days.
Initial download of the metrics may take a while.