Fig. 1
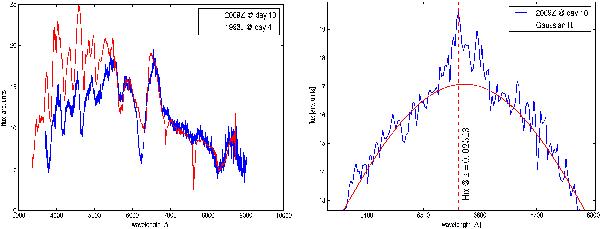
Left, an optical spectrum of SN 2009Z (blue line) obtained 10 days after maximum light with the 2.5 m du Pont Telescope at Las Campanas Observatory is shown. The spectrum is de-redshifted using z = 0.02513 as derived from our H I observations (see Sect. 2.3). A similar spectrum of SN 1993J, the archetype explosion for type IIb events, obtained 4 days after bolometric maximum (see Barbon et al. 1995), is overlaid (red line) for comparison. Fluxes of both spectra were normalized at 6000 Å. In the right panel, the region around the Hα line of SN 2009Z is shown. A Gaussian fit (red line) to this line reveals the presence of a small amount of Hα emission “on top” of the broad supernova line. This additional Hα flux is most likely to originate from the host galaxy N271.
Current usage metrics show cumulative count of Article Views (full-text article views including HTML views, PDF and ePub downloads, according to the available data) and Abstracts Views on Vision4Press platform.
Data correspond to usage on the plateform after 2015. The current usage metrics is available 48-96 hours after online publication and is updated daily on week days.
Initial download of the metrics may take a while.