Fig. 5
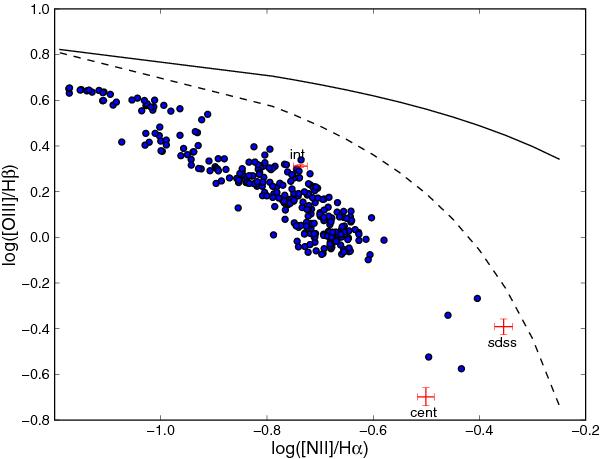
The N2O3 diagnostic diagram for our central spectrum (cent), the SDSS spectrum (sdss), the total integrated our spectrum (int), and the individual fibre-spectra of signal-to-noise ratio >5σ and Hα line intensity >3 × 10-16 erg s-1 cm-2 arcsec-2 (blue dots). The solid and dashed lines separate the zones of starburst galaxies (below the lines) and AGNs (above the lines) as defined by Kewley et al. (2001) and Kauffmann et al. (2003), respectively.
Current usage metrics show cumulative count of Article Views (full-text article views including HTML views, PDF and ePub downloads, according to the available data) and Abstracts Views on Vision4Press platform.
Data correspond to usage on the plateform after 2015. The current usage metrics is available 48-96 hours after online publication and is updated daily on week days.
Initial download of the metrics may take a while.