Fig. 2
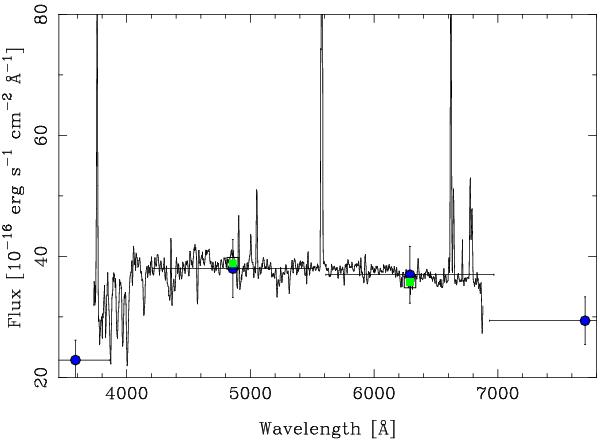
The flux recalibration based on SDSS photometry. Our spectrum of the 30′′ diameter central region of UGC 9837, scaled by the average offset between it and the SDSS g′ and r′ band photometry, is shown as a black line. The SDSS u′,g′,r′, and i′, band photometry are shown as blue dots and our spectrophotometry before rescaling at g′ and r′ bands as green squares.
Current usage metrics show cumulative count of Article Views (full-text article views including HTML views, PDF and ePub downloads, according to the available data) and Abstracts Views on Vision4Press platform.
Data correspond to usage on the plateform after 2015. The current usage metrics is available 48-96 hours after online publication and is updated daily on week days.
Initial download of the metrics may take a while.