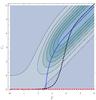
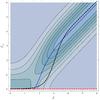
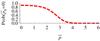
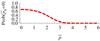
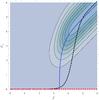
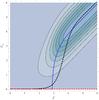
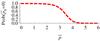
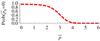
Fig. 9

These four panels show the posterior distribution
 with prior
  for four combinations of value of A and σ. The
blue dotted line is the median estimator. The black dashed line is the mean
estimator. The red, dashed line at
for four combinations of value of A and σ. The
blue dotted line is the median estimator. The black dashed line is the mean
estimator. The red, dashed line at  is a reminder of the finite amount of probability that exists along the
 -axis
due to the delta function term. No such line is needed in Figs. 7a and 7b because
A = 0 there and the delta term does not contribute. This
probability along the -axis
is plotted underneath each contour plot.
-axis
due to the delta function term. No such line is needed in Figs. 7a and 7b because
A = 0 there and the delta term does not contribute. This
probability along the -axis
is plotted underneath each contour plot.
Current usage metrics show cumulative count of Article Views (full-text article views including HTML views, PDF and ePub downloads, according to the available data) and Abstracts Views on Vision4Press platform.
Data correspond to usage on the plateform after 2015. The current usage metrics is available 48-96 hours after online publication and is updated daily on week days.
Initial download of the metrics may take a while.