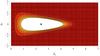
Fig. 3
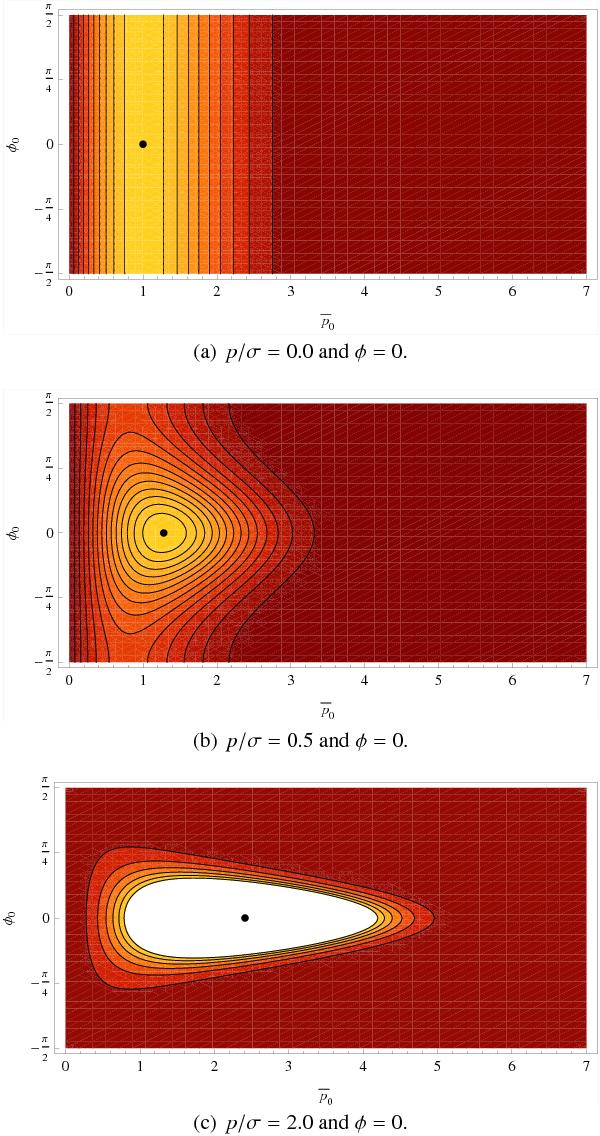
Contour plots of  (Eq. (20)) for a few different values of
p/σ with
φ = 0 assuming a Jeffreys prior
(
(Eq. (20)) for a few different values of
p/σ with
φ = 0 assuming a Jeffreys prior
( ) and
I0/Σ = 100. The dots indicate the
maximums of the distributions. Contour spacings are at intervals of 0.02. This
figure is nearly the same as Fig. 1 with the roles
of p and p0 reversed. While for small
values of p/σ and
p0/σ the plots
appear identical, they are not. Their similarity diverges for larger values of
signal-to-noise, as they must since
p0/σ has a maximum
value while p/σ does not.
) and
I0/Σ = 100. The dots indicate the
maximums of the distributions. Contour spacings are at intervals of 0.02. This
figure is nearly the same as Fig. 1 with the roles
of p and p0 reversed. While for small
values of p/σ and
p0/σ the plots
appear identical, they are not. Their similarity diverges for larger values of
signal-to-noise, as they must since
p0/σ has a maximum
value while p/σ does not.
Current usage metrics show cumulative count of Article Views (full-text article views including HTML views, PDF and ePub downloads, according to the available data) and Abstracts Views on Vision4Press platform.
Data correspond to usage on the plateform after 2015. The current usage metrics is available 48-96 hours after online publication and is updated daily on week days.
Initial download of the metrics may take a while.