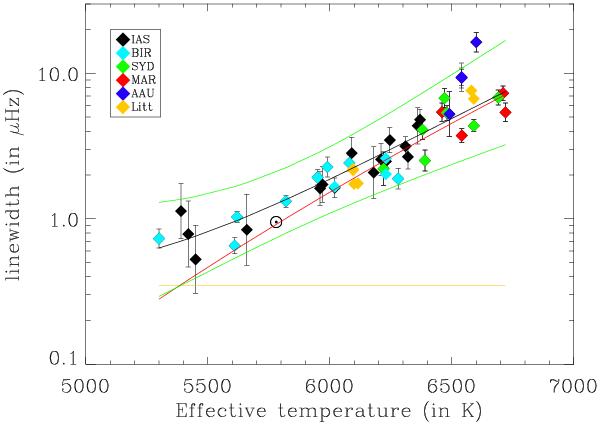
Fig. 2

Average mode linewidth at maximum mode height (and their 3-σ error bars) as a function of effective temperature (provided by Pinsonneault et al. 2011). The error bars in the effective temperatures, although not shown here, are indeed included in the error analysis. Average mode linewidth fitted by IAS (black), by BIR (cyan), by SYD (green), by MAR (red), by AAU (blue), from Baudin et al. (2011a) (orange). Fitted average linewidth (black line). The 3-σ error bars in the fitted average linewidth (green lines). Power-law component of the fit (red line). Flat component at low Teff (orange line). The mean mode linewidth of the Sun is indicated at 5777 K.
Current usage metrics show cumulative count of Article Views (full-text article views including HTML views, PDF and ePub downloads, according to the available data) and Abstracts Views on Vision4Press platform.
Data correspond to usage on the plateform after 2015. The current usage metrics is available 48-96 hours after online publication and is updated daily on week days.
Initial download of the metrics may take a while.


