Fig. 8
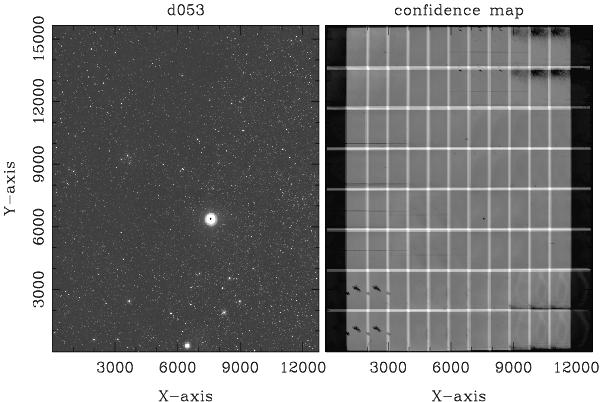
Left panel: the disk tile d053 in the Ks band with its corresponding confidence map shown in the right panel. The brighter regions in the confidence map have a longer total exposure time, owing to the combination of the six pawprints. This image also includes two jitters at each pawprint position. Clearly visible in the lower left corner is a cluster of bad pixels (Chip 1). The six different positions correspond to the six pawprints, which are combined to fill the gaps between individual detectors.
Current usage metrics show cumulative count of Article Views (full-text article views including HTML views, PDF and ePub downloads, according to the available data) and Abstracts Views on Vision4Press platform.
Data correspond to usage on the plateform after 2015. The current usage metrics is available 48-96 hours after online publication and is updated daily on week days.
Initial download of the metrics may take a while.