Fig. 17
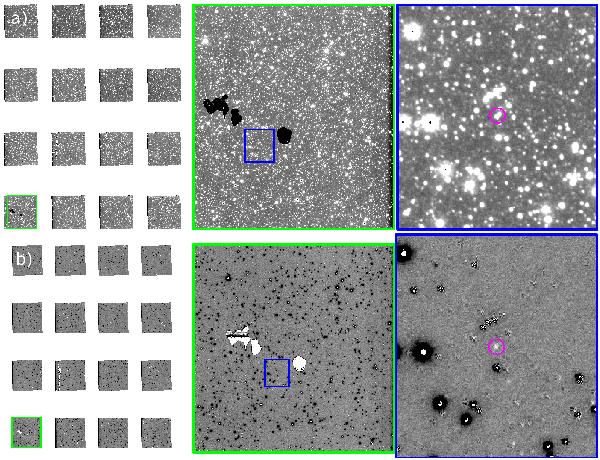
a) Ks band pawprint from one VVV SV bulge field epoch showing views of the full pawprint (left); a zoom into array 1 (middle); and another zoom centred on a circled variable object (right). b) The bottom row shows the respective difference image views. Blackened objects are DIA residuals around saturated stars, which comprise a non-negligible fraction of the image area for bulge fields.
Current usage metrics show cumulative count of Article Views (full-text article views including HTML views, PDF and ePub downloads, according to the available data) and Abstracts Views on Vision4Press platform.
Data correspond to usage on the plateform after 2015. The current usage metrics is available 48-96 hours after online publication and is updated daily on week days.
Initial download of the metrics may take a while.