Fig. 15
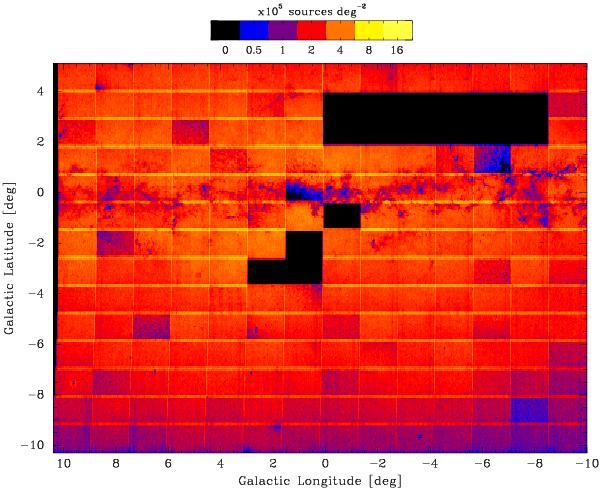
Density map in logarithmic scale showing the VVV bulge area. The map was made using all stellar point sources detected in the J, H, and Ks 1.1 CASU catalogues. Crowded areas appear in yellow, while less populated regions and high-extinction areas are shown in blue. The overlapping regions between the tiles are highlighted because the point sources are detected twice, which generates the grid pattern that also indicates the size of overlap regions. The density, in units of 105 sources deg-2, is indicated in the horizontal bar at the top.
Current usage metrics show cumulative count of Article Views (full-text article views including HTML views, PDF and ePub downloads, according to the available data) and Abstracts Views on Vision4Press platform.
Data correspond to usage on the plateform after 2015. The current usage metrics is available 48-96 hours after online publication and is updated daily on week days.
Initial download of the metrics may take a while.