Fig. 14
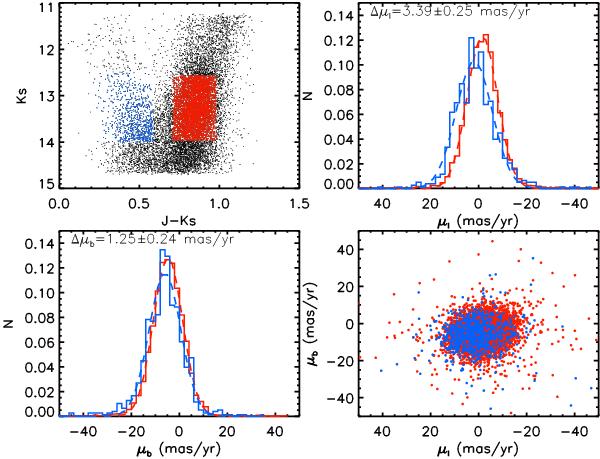
Top left panel: Ks vs. (J − Ks) CMD for a 10 × 10 arcmin2 region in tile b249 for VVV stellar sources matched with 2MASS. The CMD is centred in the region of the bulge red clump (red) and the disk main sequence (blue). Top right panel: histogram of the longitudinal proper motion for both selected regions in the CMD. The mean values for Δα × cosδ and Δδ are shown in the top left corner. Bottom left panel: same as top right panel for the latitudinal proper motion distribution. Bottom right panel: the μb vs. μl distribution in units of mas yr-1.
Current usage metrics show cumulative count of Article Views (full-text article views including HTML views, PDF and ePub downloads, according to the available data) and Abstracts Views on Vision4Press platform.
Data correspond to usage on the plateform after 2015. The current usage metrics is available 48-96 hours after online publication and is updated daily on week days.
Initial download of the metrics may take a while.