Fig. 10
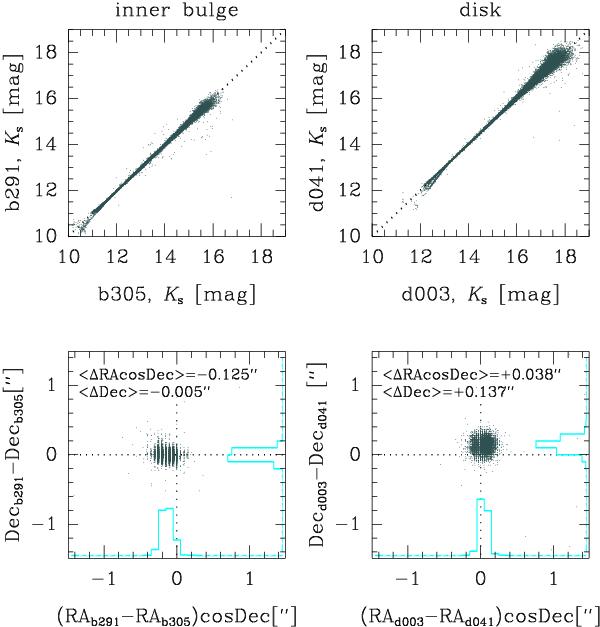
Top panels: photometry in the Ks-band for the overlapping region between tiles b291 and b305 (left), and d003 and d041 (right). Only stellar sources were used in these plots. Bottom panels: astrometric accuracy for the same overlapping regions. The mean values for Δα × cosδ and Δδ are shown in the top left corner. Counting histograms for the distribution are also shown for both axes.
Current usage metrics show cumulative count of Article Views (full-text article views including HTML views, PDF and ePub downloads, according to the available data) and Abstracts Views on Vision4Press platform.
Data correspond to usage on the plateform after 2015. The current usage metrics is available 48-96 hours after online publication and is updated daily on week days.
Initial download of the metrics may take a while.