Fig. 6
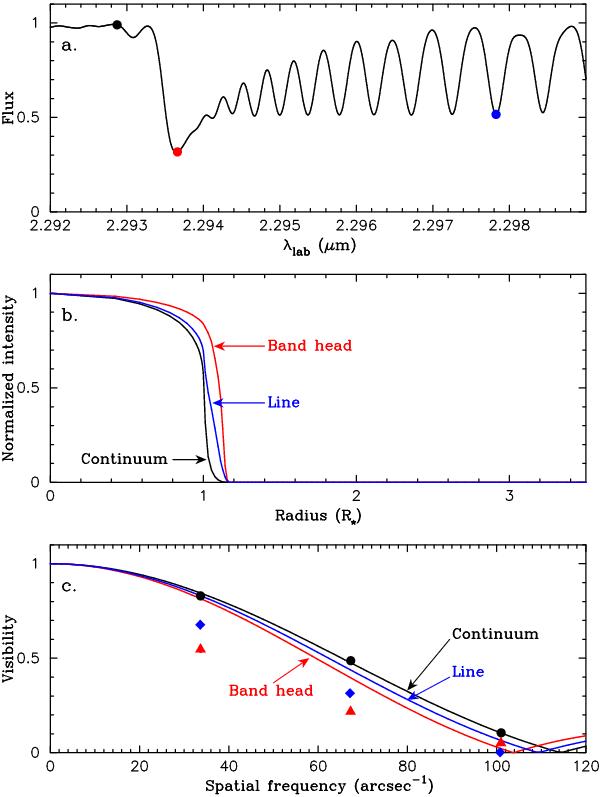
MARCS model for BK Vir. a) Model spectrum near the CO band head. The black, red, and blue dots represent the wavelengths of the intensity profiles and visibilities shown in panels b) and c). b) Model intensity profiles for the continuum (black), CO band head (red) and an isolated CO line (blue). c) Model visibilities for the continuum, CO band head, and an isolated CO line are shown by the black, red, and blue solid lines, respectively. The filled dots, triangles, and diamonds represent the observed visibilities in the continuum, CO band head, and the isolated CO line (data set #3).
Current usage metrics show cumulative count of Article Views (full-text article views including HTML views, PDF and ePub downloads, according to the available data) and Abstracts Views on Vision4Press platform.
Data correspond to usage on the plateform after 2015. The current usage metrics is available 48-96 hours after online publication and is updated daily on week days.
Initial download of the metrics may take a while.