Fig. 5
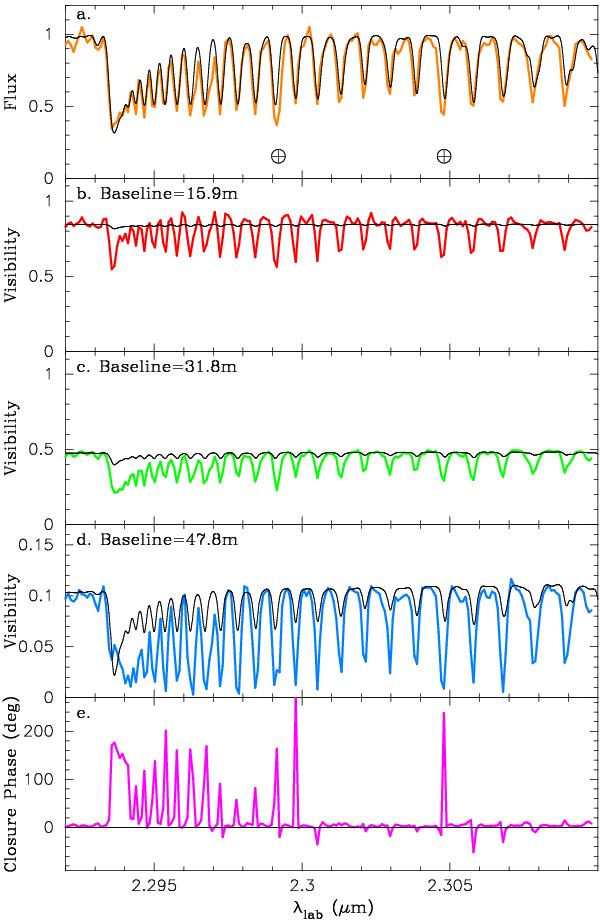
Comparison between the observed interferometric data (data set #3) and the MARCS model. In all panels, the black thin lines represent the predictions of the MARCS model with the parameters most appropriate for BK Vir (see Sect. 4.2). The thick colored lines represent the observed data. a) Spectrum. Residuals of the strong telluric lines are marked by ⊕ . b) − d) Visibilities on the 15.9, 31.8, and 47.8 m baselines, respectively. e) Closure phase.
Current usage metrics show cumulative count of Article Views (full-text article views including HTML views, PDF and ePub downloads, according to the available data) and Abstracts Views on Vision4Press platform.
Data correspond to usage on the plateform after 2015. The current usage metrics is available 48-96 hours after online publication and is updated daily on week days.
Initial download of the metrics may take a while.