Fig. 4
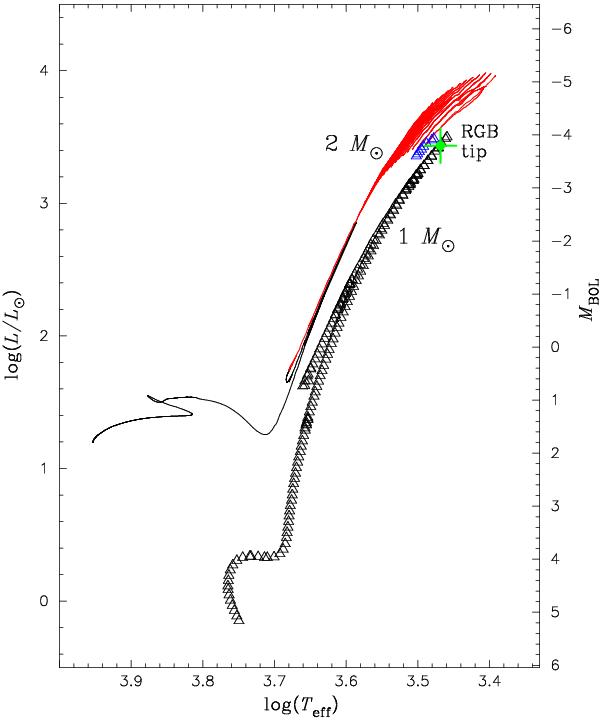
Observationally derived position of BK Vir on the H-R diagram (green dot with the error bars). The open triangles and solid line represent the evolutionary tracks for a 1 and 2 M⊙ star from Bertelli et al. (2008) and Herwig (2005), respectively. The AGB stage (early AGB and thermally-pulsing AGB) is marked in blue and red for the evolutionary tracks for 1 M⊙ and 2 M⊙, respectively.
Current usage metrics show cumulative count of Article Views (full-text article views including HTML views, PDF and ePub downloads, according to the available data) and Abstracts Views on Vision4Press platform.
Data correspond to usage on the plateform after 2015. The current usage metrics is available 48-96 hours after online publication and is updated daily on week days.
Initial download of the metrics may take a while.