Fig. 2
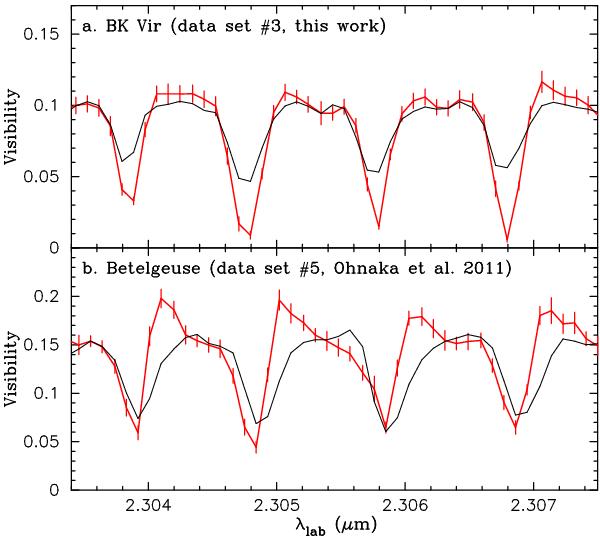
Visibilities in four representative CO first overtone lines in the red giant BK Vir (panel a)) and the red supergiant Betelgeuse (panel b)). In both panels the black solid lines represent the scaled observed spectra. The red solid lines represent the visibility obtained for BK Vir on the 47.8 m baseline (panel a)) and that obtained for Betelgeuse on the 11.54 m baseline (panel b)).
Current usage metrics show cumulative count of Article Views (full-text article views including HTML views, PDF and ePub downloads, according to the available data) and Abstracts Views on Vision4Press platform.
Data correspond to usage on the plateform after 2015. The current usage metrics is available 48-96 hours after online publication and is updated daily on week days.
Initial download of the metrics may take a while.