Fig. 1
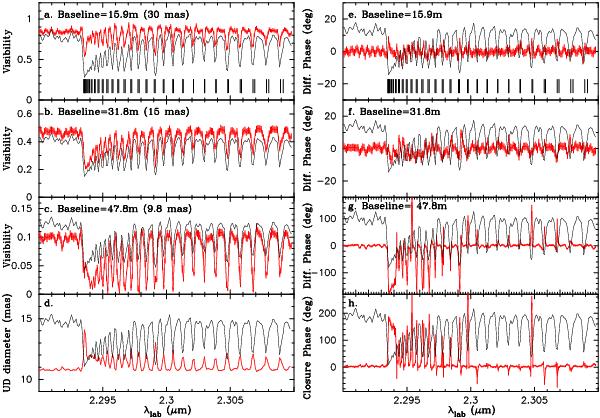
AMBER data of BK Vir (data set #3). In each panel, the scaled observed spectrum is plotted by the black solid lines. a)–c) Visibilities observed on the 15.9, 31.8, and 47.8 m baselines (red lines). The corresponding spatial resolutions are also given. d) Uniform-disk diameter (red line) derived by fitting the visibilities shown in panels a)–c). e)–g) Differential phases observed on the 15.9, 31.8, and 47.8 m baselines (red lines). h) Closure phase (red line).
Current usage metrics show cumulative count of Article Views (full-text article views including HTML views, PDF and ePub downloads, according to the available data) and Abstracts Views on Vision4Press platform.
Data correspond to usage on the plateform after 2015. The current usage metrics is available 48-96 hours after online publication and is updated daily on week days.
Initial download of the metrics may take a while.