Fig. 8
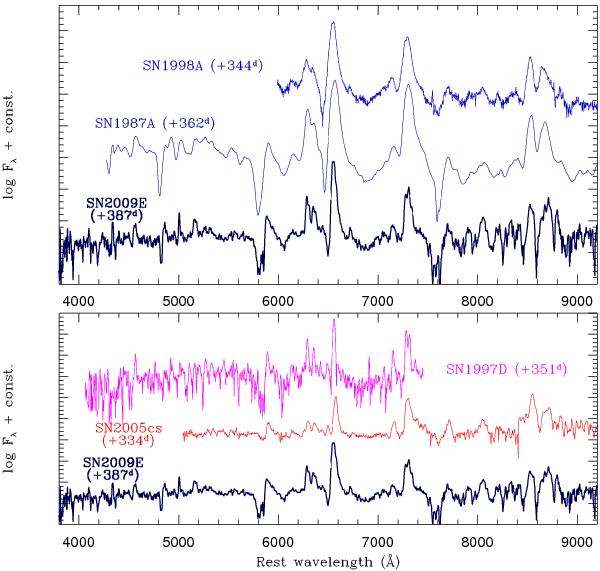
Top: a nebular spectrum of SN 2009E is compared with spectra of SNe 1998A (Pastorello et al. 2005) and 1987A (Pun et al. 1995) at a similar phase (~1 year). The nebular spectrum of SN 2009E was obtained averaging spectra of 2010 Jan. 22nd and 24th. Bottom: the nebular spectrum of SN 2009E is compared with spectra of underluminous type IIP SNe obtained about 1 year after core-collapse (Benetti et al. 2001; Pastorello et al. 2009).
Current usage metrics show cumulative count of Article Views (full-text article views including HTML views, PDF and ePub downloads, according to the available data) and Abstracts Views on Vision4Press platform.
Data correspond to usage on the plateform after 2015. The current usage metrics is available 48-96 hours after online publication and is updated daily on week days.
Initial download of the metrics may take a while.