Fig. 4
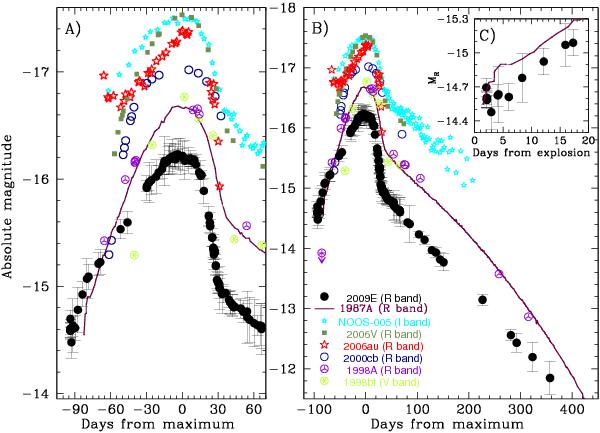
R-band absolute light curve of SN 2009E compared with the absolute light curves of a number of 1987A-like events: NOOS-005 (I band, OGLE collaboration), SNe 2006V, 2006au, 1998bt (V band, seeGermany 1998), 2000cb, 1998A and the prototype 1987A. Panel A): detail on the broad light curve peak. Panel B): the full light curve evolution. Panel C): blow-up of the very early-time light curves of SNe 2009E and 1987A, soon after shock break-out.
Current usage metrics show cumulative count of Article Views (full-text article views including HTML views, PDF and ePub downloads, according to the available data) and Abstracts Views on Vision4Press platform.
Data correspond to usage on the plateform after 2015. The current usage metrics is available 48-96 hours after online publication and is updated daily on week days.
Initial download of the metrics may take a while.