Fig. 2
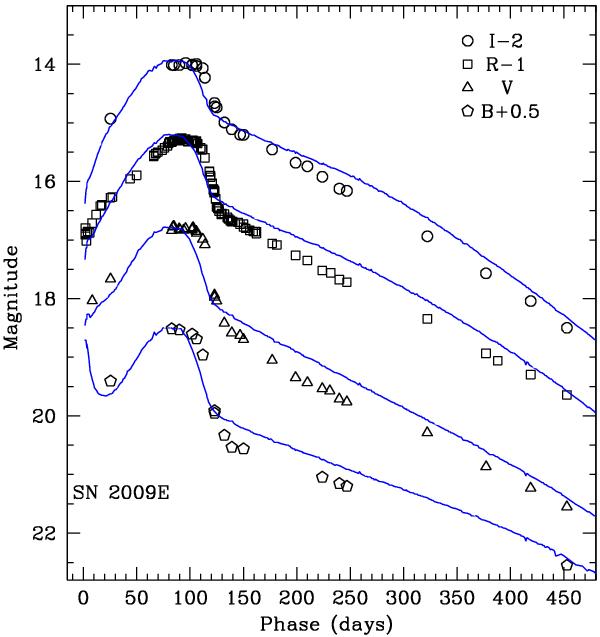
B, V, R and I-band light curves of SN 2009E compared with those of SN 1987A (solid blue line; Menzies et al. 1987; Catchpole et al. 1987, 1988, 1989; Whitelock et al. 1988, 1989), shifted arbitrarily in magnitude to match the peak magnitudes of SN 2009E.
Current usage metrics show cumulative count of Article Views (full-text article views including HTML views, PDF and ePub downloads, according to the available data) and Abstracts Views on Vision4Press platform.
Data correspond to usage on the plateform after 2015. The current usage metrics is available 48-96 hours after online publication and is updated daily on week days.
Initial download of the metrics may take a while.