Fig. 9
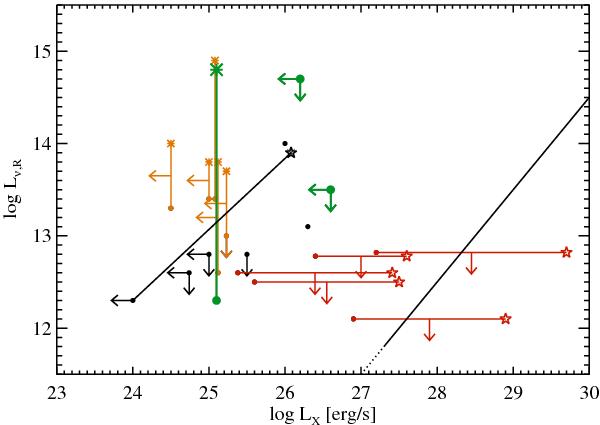
Radio vs. X-ray luminosity for UCDs including DENIS 1048-3956 (green larger symbols connected by the vertical line), PC 0025+0447, and DENIS 1228-1547 (both also shown in green and larger). The Benz-Güdel-relation for more massive late-type stars is represented by the black solid line and its extrapolation to low luminosities is dotted. The lowest observed emission level of each object is shown as a circle. Two groups with distinct flaring behavior in the radio (orange with asterisks for the flares) and X-ray (red with star symbols for the flares) bands are identified. Objects that cannot be assigned to any of the groups (yet) are shown in black.
Current usage metrics show cumulative count of Article Views (full-text article views including HTML views, PDF and ePub downloads, according to the available data) and Abstracts Views on Vision4Press platform.
Data correspond to usage on the plateform after 2015. The current usage metrics is available 48-96 hours after online publication and is updated daily on week days.
Initial download of the metrics may take a while.