Fig. 8
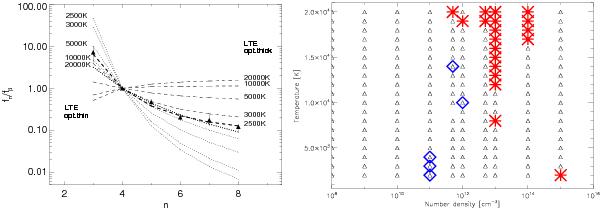
Theoretical predictions for Balmer decrements: (left) – optically thick (dashed) and optically thin (dotted) gas in LTE and observed flux ratios for DENIS 1048-3956. For both the optically thick and the optically thin case, the model with the temperature that best fits the observed decrements is highlighted as a thick line. (Right) – grid of temperature and electron density for a recombining hydrogen plasma. Models compatible with the observed Balmer decrements of DENIS 1048-3956 are marked by large colored symbols: blue diamonds (Hα/Hβ) and red asterisks (the higher-n decrements).
Current usage metrics show cumulative count of Article Views (full-text article views including HTML views, PDF and ePub downloads, according to the available data) and Abstracts Views on Vision4Press platform.
Data correspond to usage on the plateform after 2015. The current usage metrics is available 48-96 hours after online publication and is updated daily on week days.
Initial download of the metrics may take a while.