Fig. 5
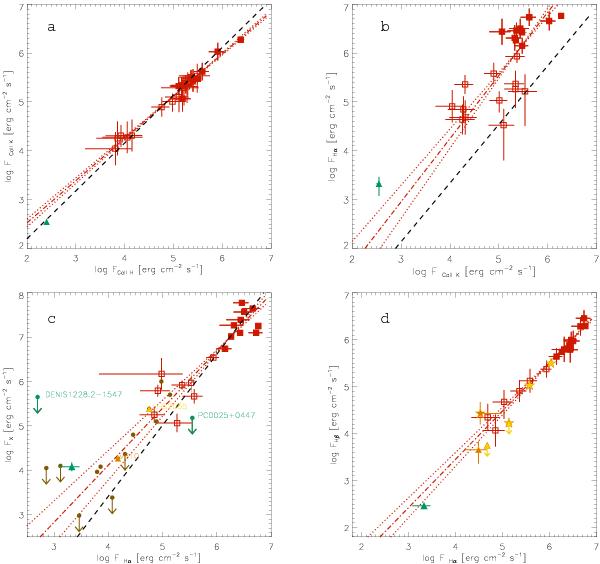
Relations between chromospheric and coronal activity diagnostics for the sample of M dwarfs from MA11 (red) with linear regression fits (red dash-dotted) and their variance (red dotted) and for comparison the fits derived by Martínez-Arnáiz et al. (2011b) for their whole sample of F-M dwarfs (black dashed): a) Ca ii K vs. Ca ii H flux; b) Hα vs. Ca ii K flux; c) X-ray vs. Hα flux; and d) Hβ vs. Hα flux. Also plotted, but not included in the fits, in all panels is DENIS 1048-3956 (green triangle), in panel c) UCDs from the literature (brown circles, orange and yellow triangles) and two UCDs for which we present new X-ray data (PC 0025+0447 and DENIS 1228-1547; green circles), and in panel d) two UCDs with both Hα and Hβ measurements from the literature (vB 10 in orange and LHS 2065 in yellow; triangles represent quiescence, and star symbols the flare state; the data points for LHS 2065 correspond to four consecutive spectra tracking the decay of a large flare and show that in the course of the flare evolution, its Hα and Hβ fluxes vary along the flux-flux relationship for earlier M dwarfs).
Current usage metrics show cumulative count of Article Views (full-text article views including HTML views, PDF and ePub downloads, according to the available data) and Abstracts Views on Vision4Press platform.
Data correspond to usage on the plateform after 2015. The current usage metrics is available 48-96 hours after online publication and is updated daily on week days.
Initial download of the metrics may take a while.