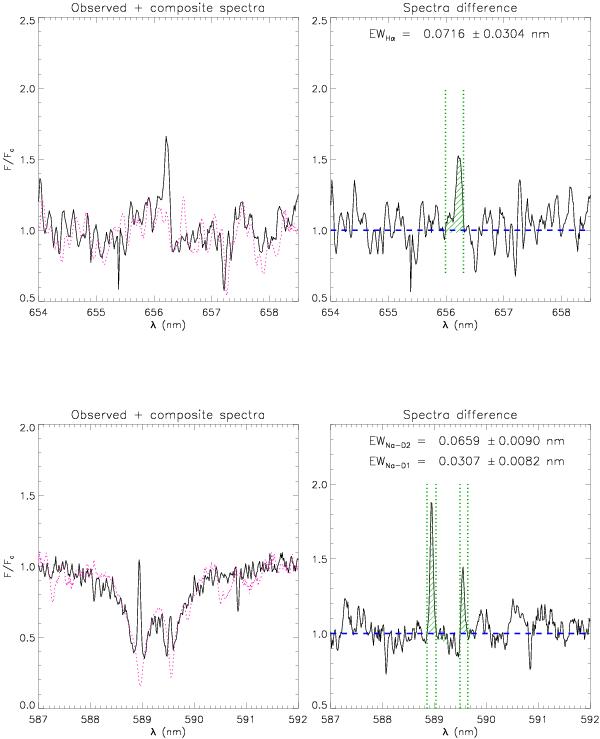
Fig. 4

Left panels: observed, continuum-normalized X-Shooter spectrum of DENIS 1048-3956 (solid line) in the Hα and Na i D regions (top and bottom, respectively), together with the synthetic template (dotted line). Right panels: difference between the observed and template spectra. The hatched areas represent the excess emissions that were integrated to derive the net equivalent width.
Current usage metrics show cumulative count of Article Views (full-text article views including HTML views, PDF and ePub downloads, according to the available data) and Abstracts Views on Vision4Press platform.
Data correspond to usage on the plateform after 2015. The current usage metrics is available 48-96 hours after online publication and is updated daily on week days.
Initial download of the metrics may take a while.


