Free Access
Fig. 8
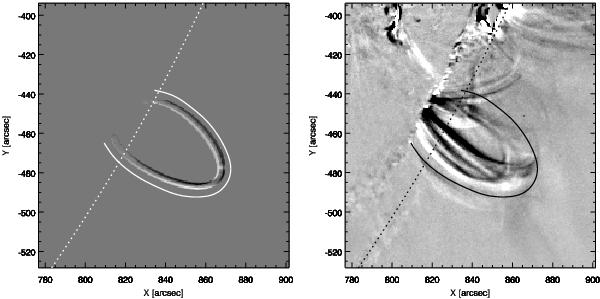
Left: simulated difference image for the modelled horizontally polarised loop 2 from Event 1. Right: difference image of Event 1 co-structured by subtracting the image taken at 5:40:23 from the one at 5:38:23 UT. The dotted line indicates the solar limb.
Current usage metrics show cumulative count of Article Views (full-text article views including HTML views, PDF and ePub downloads, according to the available data) and Abstracts Views on Vision4Press platform.
Data correspond to usage on the plateform after 2015. The current usage metrics is available 48-96 hours after online publication and is updated daily on week days.
Initial download of the metrics may take a while.