Fig. 3
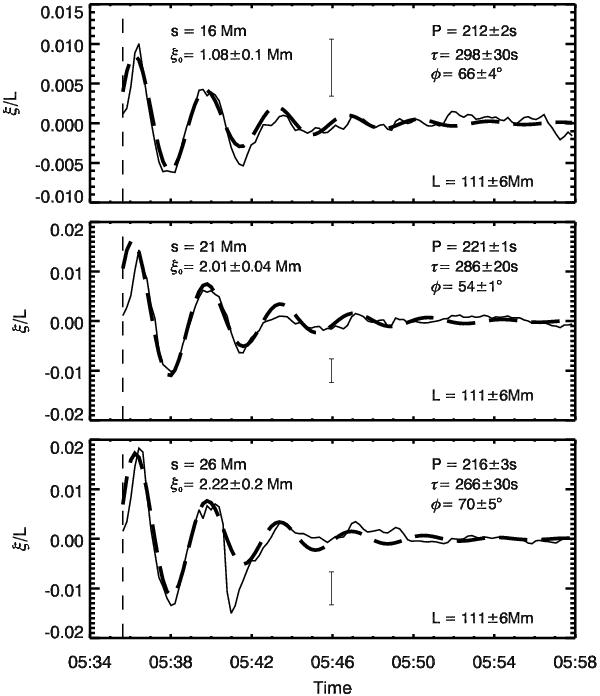
Automatically determined time series (solid line) for three of the cuts taken to analyse loop 2 in Event 1 fitted with a damped cosine function (thick dashed line). Top: s = 16 Mm. Center: s = 21 Mm. Bottom: s = 26 Mm. The errors on the fitting parameters are the errors given by the fitting technique. The error bars on each plot show the typical size of the error in the loop position. The displacement amplitude has been normalised by the loop length. The vertical dashed line indicates the start of the oscillation at t0 = 05:35:59 UT.
Current usage metrics show cumulative count of Article Views (full-text article views including HTML views, PDF and ePub downloads, according to the available data) and Abstracts Views on Vision4Press platform.
Data correspond to usage on the plateform after 2015. The current usage metrics is available 48-96 hours after online publication and is updated daily on week days.
Initial download of the metrics may take a while.