Fig. 2
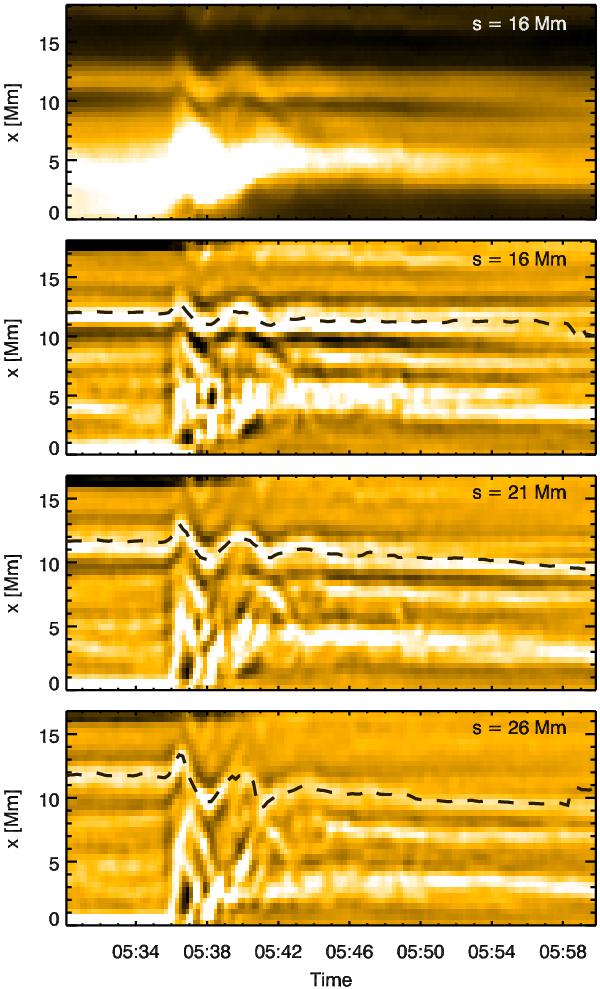
Time distance images extracted from cuts taken to analyse loop 2 in Event 1. The top cut shows an example of the time distance images before a 2D mexican hat wavelet transform has been applied to enhance oscillatory features, as shown by the bottom three cuts. The automatically determined time series from the Gaussian plus background fit for loop 2 has been plotted on the wavelet enhanced cuts.
Current usage metrics show cumulative count of Article Views (full-text article views including HTML views, PDF and ePub downloads, according to the available data) and Abstracts Views on Vision4Press platform.
Data correspond to usage on the plateform after 2015. The current usage metrics is available 48-96 hours after online publication and is updated daily on week days.
Initial download of the metrics may take a while.