Free Access
Fig. 10
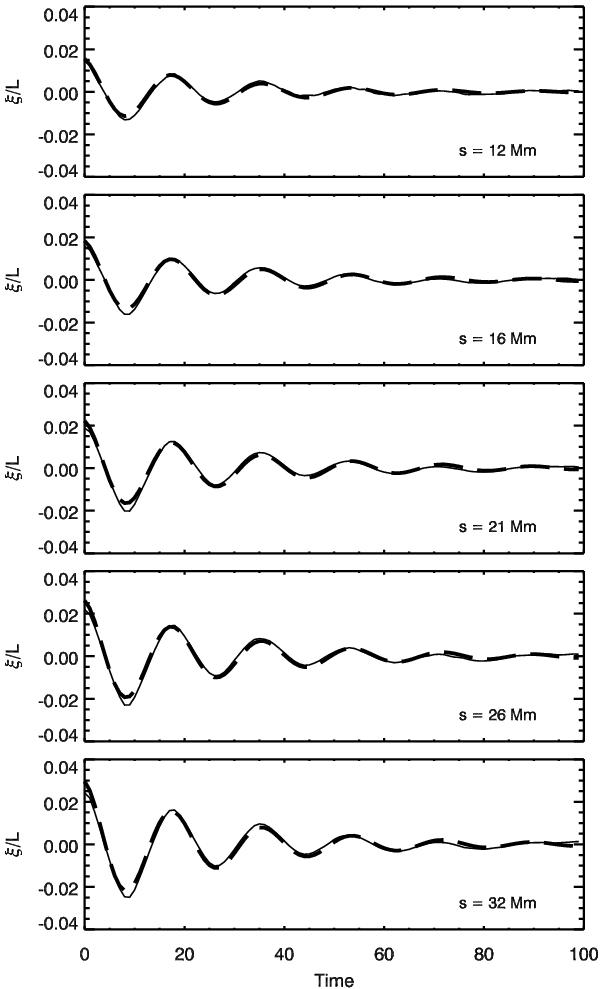
Automatically determined time series (solid line) for the cuts displayed in Fig. 9 fitted with a damped cosine function (thick dashed line). The displacement amplitude has been normalised by the loop length. The s distance along the loop corresponds to the position of the cuts relative to the observed loop in the AIA image.
Current usage metrics show cumulative count of Article Views (full-text article views including HTML views, PDF and ePub downloads, according to the available data) and Abstracts Views on Vision4Press platform.
Data correspond to usage on the plateform after 2015. The current usage metrics is available 48-96 hours after online publication and is updated daily on week days.
Initial download of the metrics may take a while.