Fig. 1
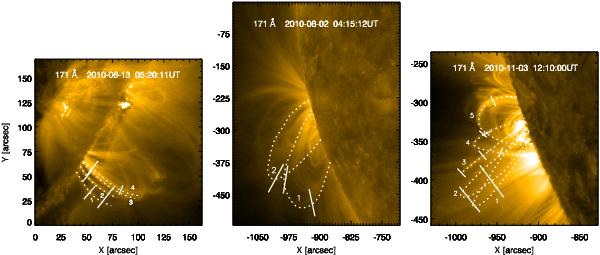
AIA/SDO 171 Å images of the three events indicating the loops of interest. Left: Event 1. White tick marks indicate the regions within which cuts are taken to study the oscillations of the four loops. Center: Event 2 where two larger, fainter loops are studied. The three cuts taken to analyse the oscillations are displayed. Right: Event 3 where five loops are studied. Again white tick marks indicate the regions within which cuts are taken to study the oscillations.
Current usage metrics show cumulative count of Article Views (full-text article views including HTML views, PDF and ePub downloads, according to the available data) and Abstracts Views on Vision4Press platform.
Data correspond to usage on the plateform after 2015. The current usage metrics is available 48-96 hours after online publication and is updated daily on week days.
Initial download of the metrics may take a while.