Fig. 8
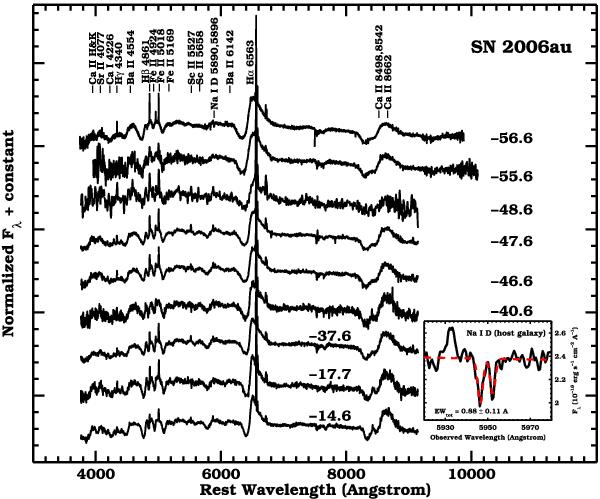
Spectral evolution of SN 2006au. Days since Bmax are reported in the figure. Overall these spectra resemble those of SN 2006V. The narrow emission lines are from the host galaxy. Shown in the inset is the spectrum obtained on 14th March 2006 plotted in the rest frame of the host galaxy, in the wavelength range where narrow Na i D absorption feature has been detected. Over-plotted (red dashed line) is the best fit of two Gaussians with a FWHM of 2.8 Å, from which we obtain a total equivalent width of 0.88 ± 0.11 Å.
Current usage metrics show cumulative count of Article Views (full-text article views including HTML views, PDF and ePub downloads, according to the available data) and Abstracts Views on Vision4Press platform.
Data correspond to usage on the plateform after 2015. The current usage metrics is available 48-96 hours after online publication and is updated daily on week days.
Initial download of the metrics may take a while.