Fig. 4
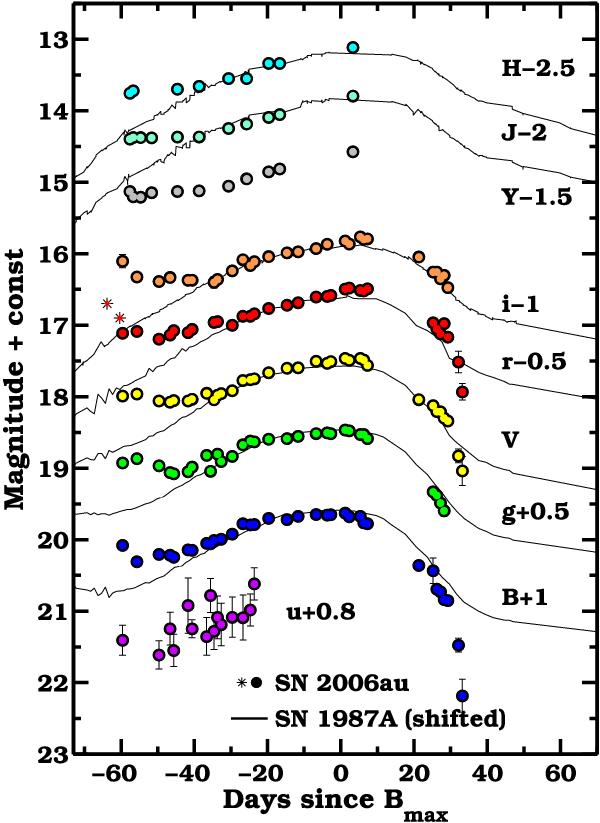
Optical and near-infrared light curves of SN 2006au. Over-plotted as solid lines are light curves of SN 1987A (J and H from Bouchet et al. 1989; I from Hamuy et al. 1988; BgVr from spectrophotometry on the spectra sample published in Phillips et al. 1988) scaled to match the peak brightness of SN 2006au. We also show (stars) the unfiltered/r magnitudes from discovery and confirmation images (Trondal et al. 2006). The two objects have nearly identical evolution between −30 to +30 days past maximum. At earlier epochs SN 2006au shows evidence of the tail end of the cooling phase that followed shock break-out. At later epochs the B, V and r-band light curves of SN 2006au appear to drop at a faster rate.
Current usage metrics show cumulative count of Article Views (full-text article views including HTML views, PDF and ePub downloads, according to the available data) and Abstracts Views on Vision4Press platform.
Data correspond to usage on the plateform after 2015. The current usage metrics is available 48-96 hours after online publication and is updated daily on week days.
Initial download of the metrics may take a while.