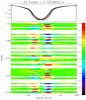
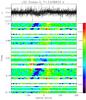
Fig. 1

LSD I profiles (left) and LSD Stokes V profiles (right) of V 2052 Oph observed with Narval. Top: the profiles themselves. The averaged I profile is also shown (dashed red) in the left panel. Bottom: a colourscale of the variation with phase. The phase is folded with HJD0 = 2 447 383.89 and Prot = 3.638833 d. For the LSD I profiles, the colourscale shows residual spectra compared to the averaged profile. The vertical dashed lines indicate ± v sin i. The zero velocity point corresponds to the laboratory wavelength reference while the profiles are centred on the stellar radial velocity value.
Current usage metrics show cumulative count of Article Views (full-text article views including HTML views, PDF and ePub downloads, according to the available data) and Abstracts Views on Vision4Press platform.
Data correspond to usage on the plateform after 2015. The current usage metrics is available 48-96 hours after online publication and is updated daily on week days.
Initial download of the metrics may take a while.