Fig. 7
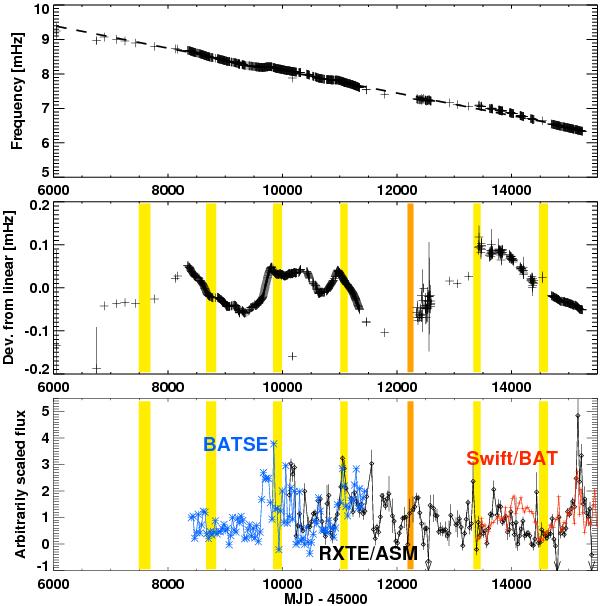
Top: long-term spin-down of GX 1+4 expressed in frequencies. Middle: residuals from the linear fit to the frequencies. The orange shaded area indicates the perigee passage time, including uncertainties, given by Hinkle et al. (2006). Yellow shaded areas indicate the perigee passage intervals extrapolated from this ephemeris. Bottom: observed X-ray fluxes in arbitrary scaling to the same mean by BATSE, RXTE/ASM, and Swift/BAT, averaged over 30-day intervals.
Current usage metrics show cumulative count of Article Views (full-text article views including HTML views, PDF and ePub downloads, according to the available data) and Abstracts Views on Vision4Press platform.
Data correspond to usage on the plateform after 2015. The current usage metrics is available 48-96 hours after online publication and is updated daily on week days.
Initial download of the metrics may take a while.