Free Access
Fig. 2
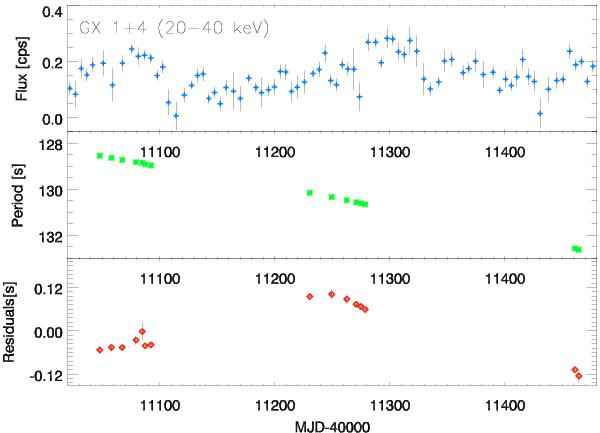
Top: GX 1+4 CGRO/BATSE daily light curve in the energy range 20–40 keV. Middle: pulse periods derived from BeppoSAX/WFC data. Note that the period increases from top to bottom. Bottom: residuals of the periods from a linear fit.
Current usage metrics show cumulative count of Article Views (full-text article views including HTML views, PDF and ePub downloads, according to the available data) and Abstracts Views on Vision4Press platform.
Data correspond to usage on the plateform after 2015. The current usage metrics is available 48-96 hours after online publication and is updated daily on week days.
Initial download of the metrics may take a while.