Fig. 5
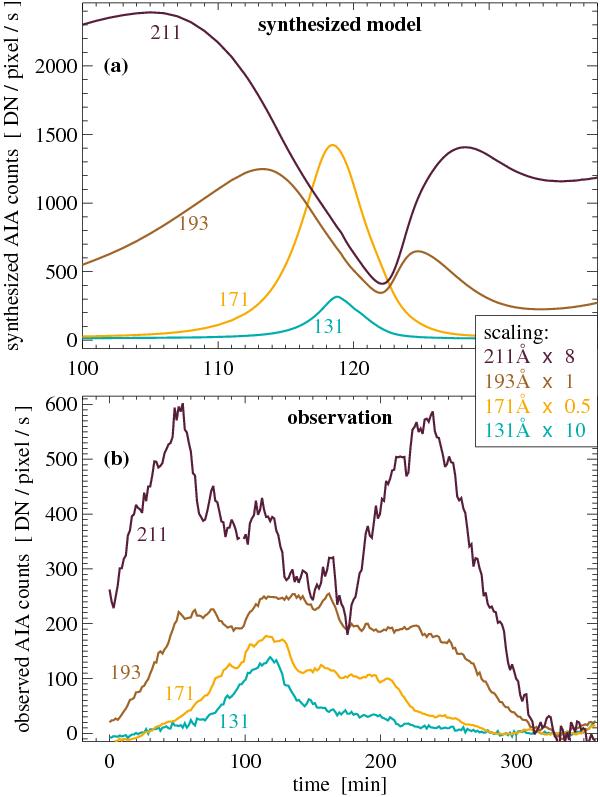
Comparison of synthesized (top) and observed (bottom) emission of catastrophic cooling in SDO/AIA bands. The count rates for the AIA bands are scaled using the factors listed in the top panel in order to fit better in a single plot. Both synthesized and observed rates are scaled by the same factors. The synthesized count rates are for an edge-on observation of the loop near the apex averaged over 1.3 Mm ( ≈ 3 AIA pixels). See Sect. 5.
Current usage metrics show cumulative count of Article Views (full-text article views including HTML views, PDF and ePub downloads, according to the available data) and Abstracts Views on Vision4Press platform.
Data correspond to usage on the plateform after 2015. The current usage metrics is available 48-96 hours after online publication and is updated daily on week days.
Initial download of the metrics may take a while.